In the dynamic realm of digital product development, making informed design decisions is paramount for creating truly impactful user experiences. Rather than relying solely on intuition or subjective opinions, modern UI/UX professionals increasingly turn to data-driven methodologies to validate and refine their creative work. A powerful tool in this arsenal is A/B testing UI/UX, a systematic approach that enables designers to compare different versions of an interface or interaction flow to determine which performs better against specific user behavior metrics.
This comprehensive guide delves into the intricacies of leveraging design experimentation for optimal user experience and interface refinement. We will explore the fundamental principles, detail the step-by-step process, highlight critical metrics, and share best practices to empower designers and creative professionals to harness the full potential of data-backed design optimization.
Understanding Experimentation in User Interface and Experience Design
At its core, experimentation in digital design, often referred to as UI/UX split testing, is about replacing assumptions with empirical evidence. It’s a scientific method applied to design, allowing teams to systematically compare versions of a design element or flow to understand which resonates best with their target audience. This methodology ensures that design decisions are rooted in actual user behavior and performance data, leading to more effective and delightful digital products.
Defining UI/UX Split Testing
UI/UX split testing involves presenting two or more variations (A and B, or more for multivariate tests) of a design element to different, randomly assigned segments of your user base simultaneously. The “control” (A) is typically the existing design, while the “variant” (B) incorporates a specific change being tested. User interactions with each version are meticulously tracked, and the resulting data is analyzed to determine which version achieves a predefined goal more effectively. This process is about comparing user responses to subtle or significant alterations, from button colors and text labels to entire navigation structures or onboarding flows.
The Hypothesis-Driven Approach to Design Iteration
Every successful user experience A/B test begins with a clear hypothesis. This isn’t just a guess; it’s an educated prediction about how a specific design change will impact user behavior, based on existing user research, analytics data, or design principles. A well-formed hypothesis follows a structured format, often like this: “If we [make this change] to [this element], then we expect [this outcome] because [of this reason].”
For example, a hypothesis might be: “If we change the primary call-to-action button color from blue to orange on the product page, then we expect an increase in click-through rate because orange is a more contrasting and attention-grabbing color that aligns with our brand’s vibrant aesthetic.” This structured thinking ensures that the test has a clear purpose, measurable goals, and a theoretical basis, preventing random testing and providing valuable learning even if the hypothesis is disproven.
Why is Iterative Testing Crucial for UI/UX Design Optimization?
In today’s competitive digital landscape, a static design is a dying design. User expectations evolve, technology advances, and market trends shift rapidly. Iterative testing, particularly through methods like interface design experimentation, provides a continuous feedback loop that is essential for maintaining relevance and delivering superior user experiences. It shifts design from a subjective art to a data-informed science.
The benefits are manifold:
- **Reduces Risk:** Instead of launching major changes that might alienate users, experiments allow for small, controlled tests to validate design decisions with minimal risk.
- **Increases Conversions and Engagement:** By optimizing elements like calls-to-action, navigation, and content hierarchy, businesses can see significant improvements in key performance indicators such as conversion rates, time on page, and task completion.
- **Enhances User Satisfaction:** Designs informed by actual user behavior are inherently more user-centric, leading to interfaces that are intuitive, efficient, and delightful to use.
- **Uncovers Unexpected Insights:** Sometimes, an experiment will yield results contrary to initial expectations, revealing deeper user preferences or pain points that might have otherwise gone unnoticed.
- **Fosters a Data-Driven Culture:** Integrating iterative testing into the design process encourages teams to think analytically, challenge assumptions, and make decisions backed by evidence rather than opinion.
[INLINE IMAGE 1: diagram showing a comparison between a control UI element and a variant UI element with different user interaction paths]
The Step-by-Step Process of Conducting User Experience A/B Tests
A structured approach is vital for running successful user experience A/B tests. Each phase requires careful planning and execution to ensure reliable results and actionable insights. This systematic process ensures that your design variant comparison yields meaningful data that can be translated into improved user experiences.
Formulating a Clear and Testable Hypothesis
Before any code is written or design is tweaked, the hypothesis must be precise. It should identify the specific design element to be changed, the expected impact on a measurable metric, and the rationale behind the prediction. For instance, “Changing the primary navigation from a top bar to a hamburger menu on mobile will increase mobile task completion rates because it provides more screen real estate and simplifies visual clutter.” This clarity ensures everyone understands the test’s objective.
Designing Your Variants with Precision
With a hypothesis in hand, the next step is to create the variant(s). The key here is to isolate the variable being tested. If you’re testing button color, don’t also change the button’s text or size. Each variant should be identical to the control except for the single change under investigation. This “one variable at a time” principle is crucial for accurately attributing any observed performance differences to the specific design alteration. Ensure designs are high-fidelity and fully functional across all relevant devices and browsers.
Setting Up the Experiment Environment
This phase involves using an A/B testing tool (e.g., Optimizely, VWO, Google Optimize, Adobe Target) to configure the test. You’ll specify the control and variant URLs or elements, define the audience segmentation (e.g., 50% see control, 50% see variant), and set up the tracking of your primary and secondary metrics. Traffic allocation must be random to ensure both groups are statistically similar and representative of your overall user base. It’s critical to ensure no external factors (like marketing campaigns) are inadvertently skewed towards one group during the test.
Data Collection and Monitoring
Once the experiment is live, the chosen A/B testing platform will automatically split user traffic and collect data on how each group interacts with their respective design versions. Constant monitoring is essential during this phase. Watch for any technical glitches, ensure data is being collected correctly, and keep an eye on initial trends. However, resist the urge to conclude the test prematurely based on early fluctuations. Data needs time to accumulate to reach statistical significance.
Analyzing Results and Ensuring Statistical Significance
After the test has run for a predetermined period and gathered sufficient data, it’s time for analysis. The primary goal is to determine if the observed difference in performance between the control and variant is statistically significant. This means calculating the p-value and confidence interval to ascertain if the results are likely due to the design change rather than random chance. A common threshold for statistical significance is a p-value less than 0.05, corresponding to a 95% confidence level. An insignificant result means you cannot confidently say one variant is better than the other, and the null hypothesis (that there is no difference) is not rejected.
Implementing Winning Designs and Iterating
If a variant proves to be a statistically significant winner, the improved design should be fully implemented for all users. However, the process doesn’t end there. The insights gained from one experiment often spark new hypotheses. What was it about the winning variant that resonated with users? Can that learning be applied elsewhere? This iterative cycle of testing, learning, and implementing is the cornerstone of continuous UX optimization through testing and digital product improvement. Document your findings thoroughly, even for losing variants, as they hold valuable lessons.
What Are the Key Metrics for Evaluating UI/UX Design Variants?
To effectively conduct experimentation for UI/UX, understanding and tracking the right metrics is paramount. These metrics provide the quantitative evidence needed to validate hypotheses and measure the impact of design changes. Focusing on specific, measurable outcomes ensures that design efforts are aligned with business objectives and user needs.
Here’s a breakdown of key metrics commonly used in user interface and experience A/B tests:
| Metric | Definition | Relevance to UI/UX A/B Testing | Example Application |
|---|---|---|---|
| Conversion Rate | Percentage of users completing a desired action (e.g., purchase, sign-up, download). | Directly measures the effectiveness of UI elements like CTAs, forms, or entire checkout flows. | Testing a new “Add to Cart” button design to see if it increases purchases. |
| Bounce Rate | Percentage of users who leave a page without interacting with it. | Indicates initial engagement and whether a page’s layout or content meets user expectations. | Testing a new landing page header image or hero text to reduce bounce rate. |
| Time on Page | The average amount of time users spend on a specific page. | Suggests content engagement and readability. Higher time on page can be positive for content-rich pages. | Testing different article layouts or font choices to increase reading duration. |
| Click-Through Rate (CTR) | Percentage of users who click on a specific link or element. | Measures the effectiveness of interactive elements, links, or navigation items. | Comparing two different icon designs for a menu item to see which gets more clicks. |
| Task Completion Rate | Percentage of users who successfully complete a defined task (e.g., filling out a form, finding information). | Directly assesses the usability and efficiency of a user flow or interaction. | Testing a revised multi-step form design to improve the rate of successful submissions. |
| Error Rate | Frequency with which users encounter or make errors within a specific interaction. | Highlights usability issues, unclear instructions, or problematic interface elements. | Testing new error messages or input field validation to reduce user submission errors. |
| User Satisfaction Score (e.g., NPS, CSAT) | Metrics derived from user surveys measuring overall satisfaction, loyalty, or ease of use. | Provides qualitative context and directly measures the emotional impact of design changes. | Measuring Net Promoter Score (NPS) after a new feature UI is rolled out to a segment. |
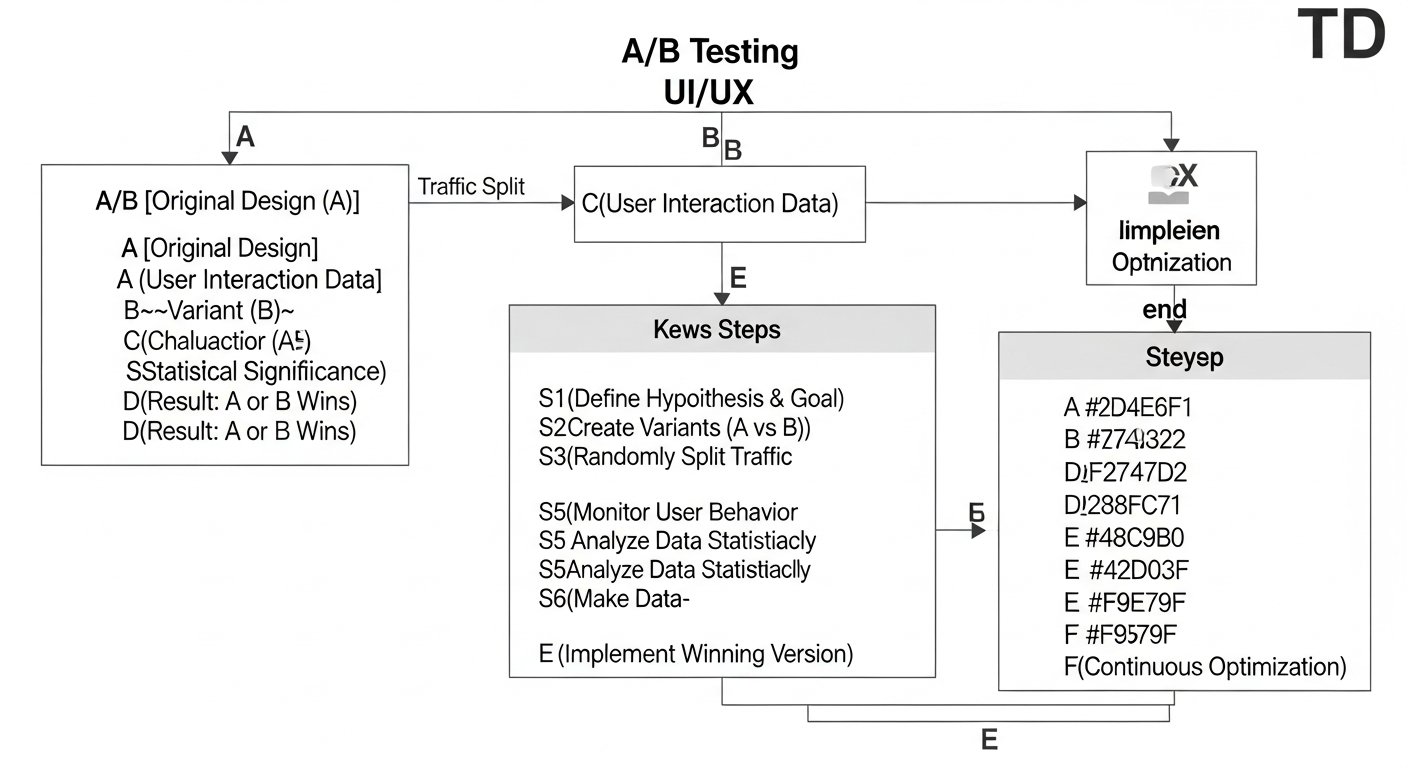
[INLINE IMAGE 2: flowchart illustrating the iterative A/B testing process from hypothesis to implementation and further iteration]
Best Practices for Successful UI/UX Design Experimentation
To maximize the effectiveness of your digital product A/B testing efforts and ensure reliable, actionable results, adhering to established best practices is essential. These guidelines help prevent common pitfalls and strengthen the integrity of your design variant comparison.
Focusing on One Variable at a Time (The Gold Standard)
This is perhaps the most critical rule. When you introduce multiple changes in a single variant, and that variant wins, you won’t know which specific change, or combination of changes, was responsible for the improved performance. This makes it impossible to learn effectively and apply those learnings elsewhere. Test one major change per variant. If you need to test combinations, consider multivariate testing, but understand its complexity and higher traffic requirements.
Ensuring Sufficient Sample Size and Test Duration
Running a test for too short a period or with too few users can lead to false positives or negatives. Statistical significance requires a certain amount of data to confidently declare a winner. Use an A/B test duration calculator (many tools include one) to determine the necessary sample size and minimum run time based on your baseline conversion rate, expected uplift, and desired statistical significance. Account for weekly cycles and potential seasonal variations in user behavior. Typically, tests should run for at least one full business cycle (e.g., 7 days) to smooth out day-of-week effects.
Interpreting Results Accurately and Avoiding Common Biases
Interpreting test results goes beyond just looking at the conversion rate. Understand the p-value and confidence intervals. A result might show a higher conversion rate for a variant, but if it’s not statistically significant, it means the observed difference could easily be due to chance. Beware of “peeking” at results too early and declaring a winner before the calculated test duration is complete, as this can inflate the chance of false positives. Always consider external factors that might influence results, such as concurrent marketing campaigns or external news events.
Common Pitfalls and How to Avoid Them in UI/UX Split Testing
Even experienced teams can stumble upon common challenges when conducting UI/UX split testing. Recognizing these pitfalls and proactively addressing them can save significant time, resources, and prevent misleading conclusions.
Testing Too Many Variables Simultaneously
As mentioned, this is a frequent error. When a variant incorporates changes to the headline, image, button color, and form fields all at once, you lose the ability to isolate the impact of individual elements. If the variant wins, you don’t know *what* worked. If it loses, you don’t know *what* failed. Stick to testing one core hypothesis at a time to derive clear, actionable insights.
Ending Tests Prematurely
“Peeking” at results and stopping a test as soon as one variant appears to be leading is a major statistical fallacy. Early leads can be due to random chance and often revert or flip as more data accumulates. Always determine your required sample size and test duration beforehand, and stick to it. Patience is a virtue in rigorous design variant comparison.
Ignoring Statistical Significance
A variant might show a 2% higher conversion rate, but if the statistical significance is low (e.g., 70% confidence), that 2% difference could easily be random noise. Implementing a change based on insignificant data is akin to guessing. Always ensure your results meet the industry-standard 95% (or higher) confidence level before making a decision to roll out a new design.
Making Assumptions Instead of Researching
While experimentation is data-driven, it doesn’t replace the need for qualitative user research. Jumping into tests without understanding *why* users might be behaving a certain way often leads to testing irrelevant changes. Combine analytics data with user interviews, usability testing, and heatmaps to inform your hypotheses, ensuring you’re testing meaningful design improvements rather than arbitrary tweaks.
Advanced Considerations for Digital Product A/B Testing
As your team gains experience with basic design experimentation, you can explore more sophisticated techniques and integrate them into a broader UI/UX strategy. These advanced methods offer deeper insights and allow for more complex optimizations.
Personalization and Multi-variate Testing (MVT)
While traditional UI/UX split testing focuses on a single variable, Multi-variate Testing (MVT) allows you to test multiple variables simultaneously to see how different combinations perform. For example, testing different headlines, images, and call-to-action buttons all at once. MVT requires significantly more traffic and a longer run time to achieve statistical significance for all combinations. Personalization, on the other hand, involves delivering different content or experiences to users based on their demographics, behavior, or preferences, often informed by A/B test learnings to create highly relevant user journeys.
Integrating A/B Testing with Other Research Methods
Digital product A/B testing is most powerful when combined with a holistic research strategy. Quantitative data from experiments can tell you *what* is happening, but qualitative methods explain *why*. Integrate A/B testing with:
- **Usability Testing:** Observe users interacting with both control and variant to understand their thought process and identify pain points.
- **Heatmaps & Session Recordings:** Visualize where users click, scroll, and spend time, providing visual context to your quantitative A/B test results.
- **Surveys & Interviews:** Directly ask users about their preferences and experiences with different variants to gather subjective feedback.
Ethical Considerations in User Experimentation
As you optimize, remember the users. Ethical considerations are paramount. Ensure that your experiments do not intentionally harm the user experience, deceive users, or exploit vulnerabilities. Always prioritize user privacy and transparency. Clearly communicate your data collection practices. Avoid dark patterns or manipulative tactics. The goal is to improve the user’s interaction, not to trick them into specific actions for short-term gains that erode trust in the long run.
Mastering the art and science of A/B testing UI/UX is an invaluable skill for any digital design professional. By systematically comparing design variants and letting user data guide your decisions, you move beyond guesswork to create experiences that are truly optimized for performance, usability, and user delight. This commitment to data-driven design ensures continuous improvement and positions your digital products for sustained success in a rapidly evolving market.
For more insights into creating compelling digital experiences and understanding the foundational concepts behind effective design, explore our broader resources on UI/UX Design Fundamentals & Process.
Sources & References
- Kohavi, R., Tang, D., & Xu, Y. (2014). Trustworthy Online Controlled Experiments: Five Puzzling Outcomes Explained. Proceedings of the 20th ACM SIGKDD International Conference on Knowledge Discovery and Data Mining.
- Croft, R., et al. (2026). The Practical Guide to A/B Testing for Digital Products. Layoutscene Press.
- Optimizely. (2026). The Ultimate Guide to A/B Testing. Retrieved from [insert a reputable Optimizely guide URL, e.g., ‘https://www.optimizely.com/optimization-glossary/ab-testing/’]
- VWO. (2026). A/B Testing: The Complete Guide for 2026. Retrieved from [insert a reputable VWO guide URL, e.g., ‘https://vwo.com/ab-testing/’]
Reviewed by Maya Singh, Senior Content Editor & UX Strategist — Last reviewed: March 28, 2026